
Build a Time in Status report
Learn how to build a report that displays the time issues spend in each status.
Play Video
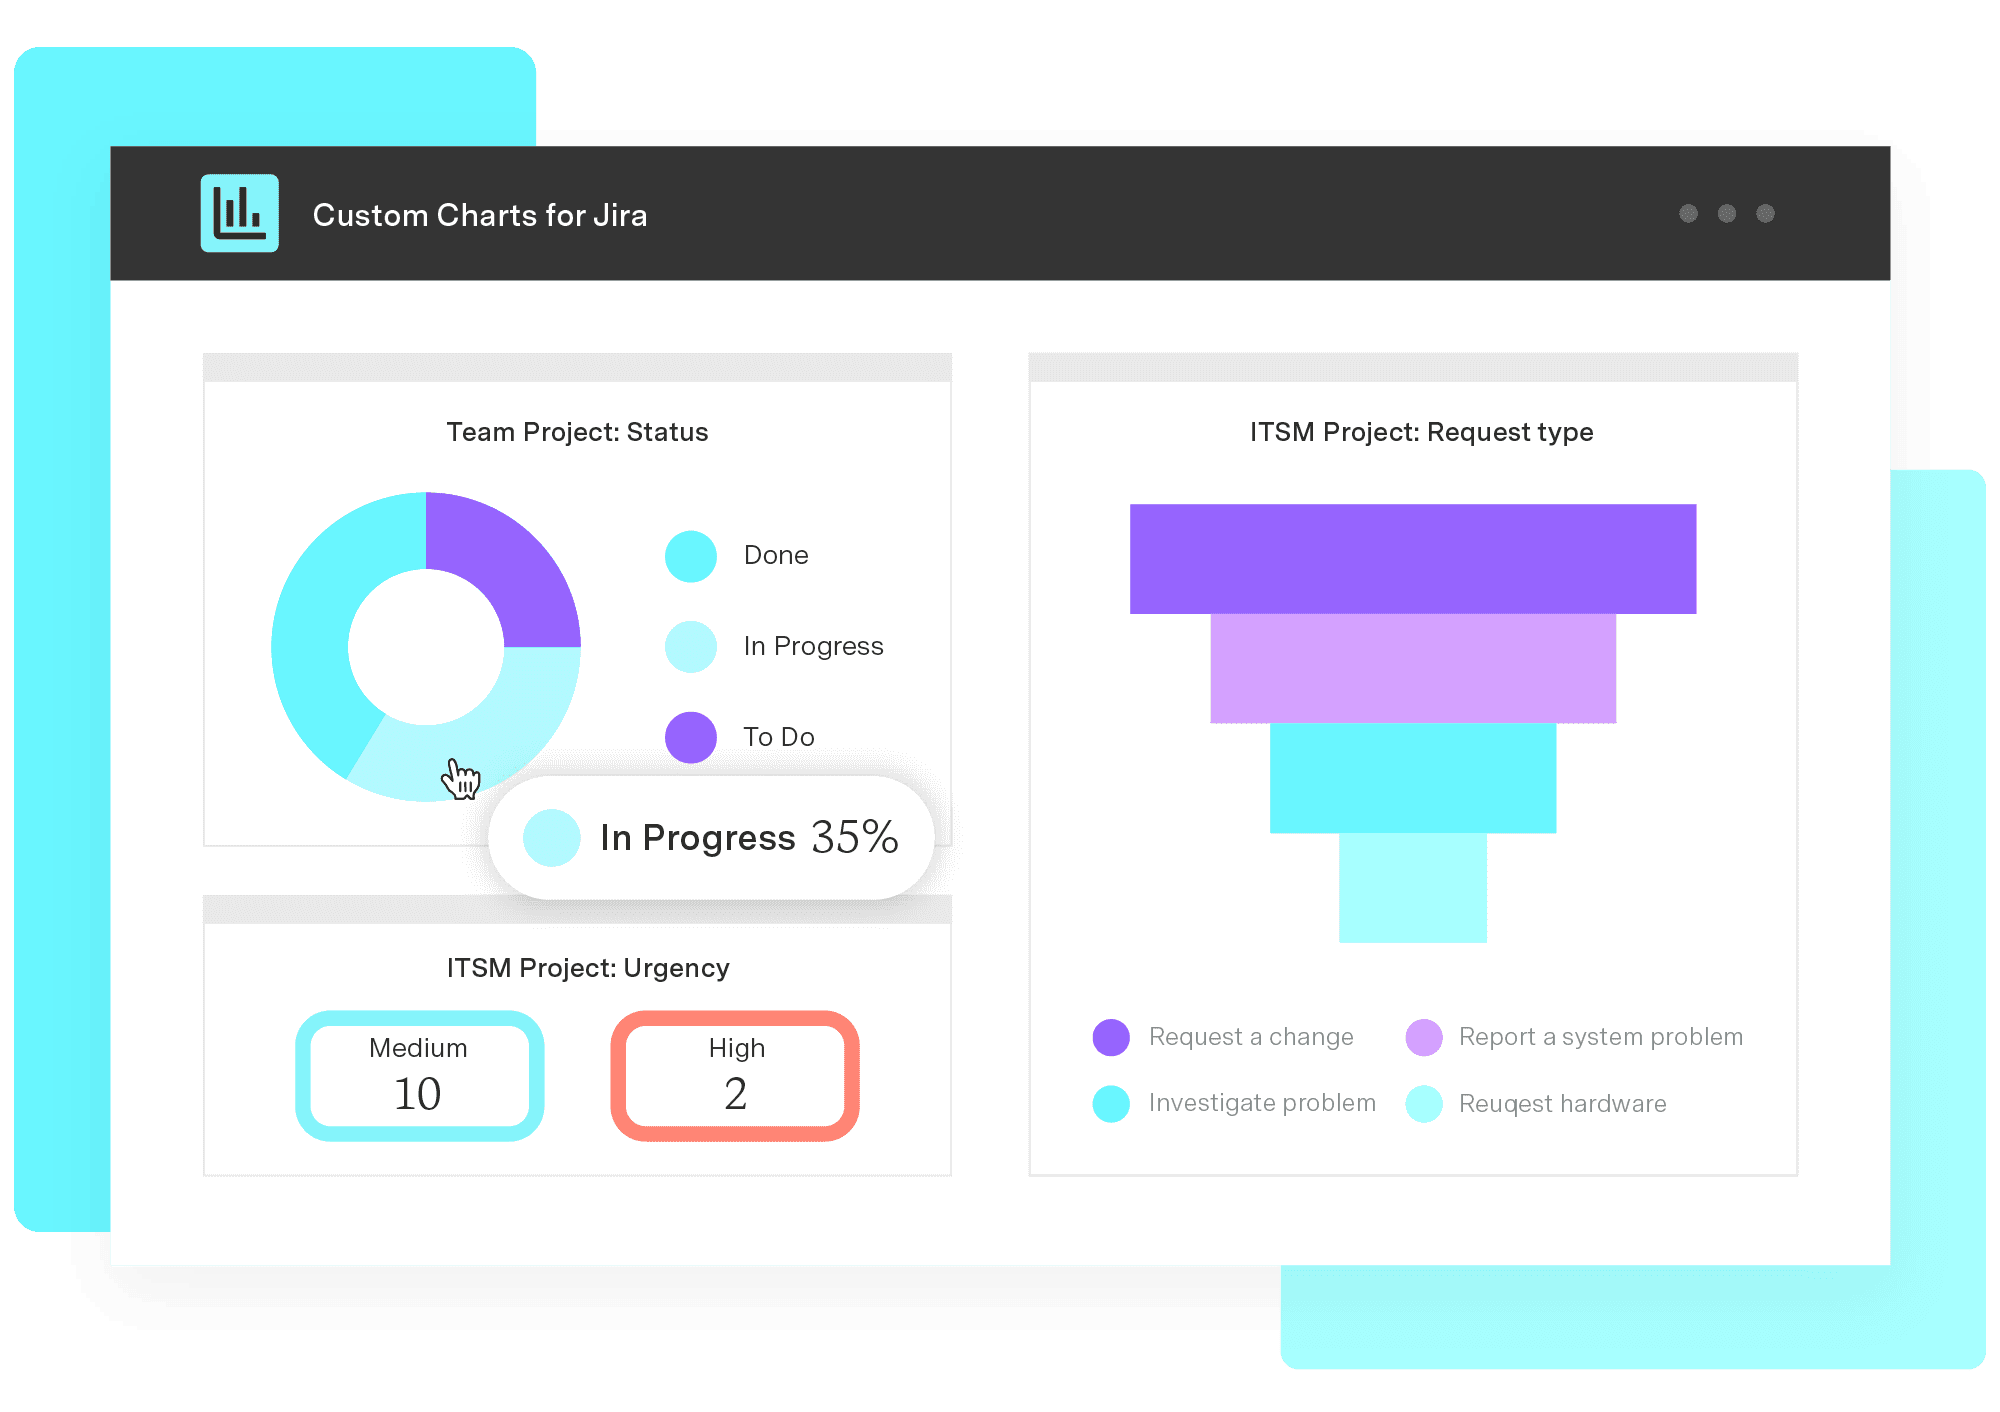
Share insights. Align teams fast.
Customizations to enhance your chart
Multiple calculations and using equations (not just issue count)
Using advanced data points (i.e. Time in Status, Issue History)

Real-time Jira insights for portfolio governance and confident decisions.
Explore CollectionBuild a Time in Status report
Learn how to build a report that displays the time issues spend in each status.
Learn more about the available chart customization options in Custom Charts.
Learn more about the different calculation options in Custom Charts.
Learn how to build 2-dimensional charts.
Learn how to create and share report templates.
Learn how to build a report that displays the time issues spend in each status.
Create a report that shows the Average Time to First Response by Assignee - hours.